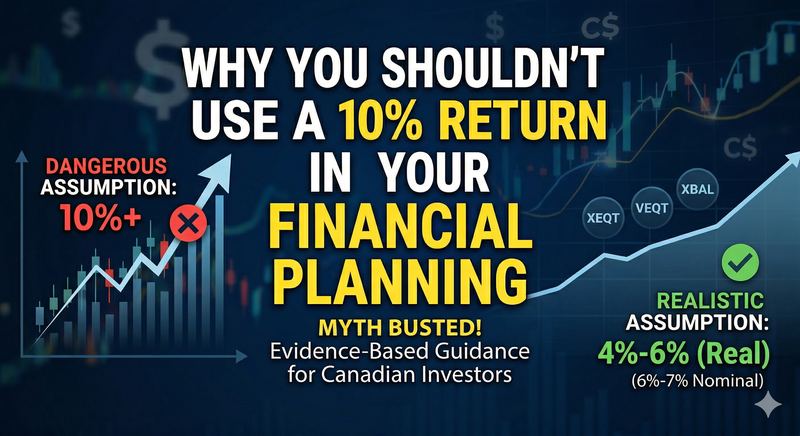
Why You Shouldn't Use a 10% Return in Your Financial Planning
I've seen a lot of YouTube videos, blog posts, and other social media claims using a 10% return in their financial planning. That's why I decided to make this blog post - to clear up some.. misconceptions!
Open up any compound interest calculator, plug in $500 a month for 30 years at 10%, and you'll get a number north of $980,000. Sounds incredible. Sounds like retirement is basically solved.
Now plug in 6% instead. You get about $490,000 — roughly half as much money.
Same savings rate. Same time horizon. One different assumption. That's the problem with the "stocks return 10% (or in some cases, more!) per year" claim you've seen plastered across investing TikTok, Instagram reels, and YouTube thumbnails. It's not just wrong — it's dangerously wrong for anyone actually making financial decisions based on it.
In this post, I'll show you exactly why that number is misleading, where it comes from, what the evidence actually says, and what Canadian investors should be using instead.
Why Your Return Assumption Matters More Than Almost Anything Else
Before we get into the data, I want to make sure the stakes are clear — because most people dramatically underestimate how much this one number affects their financial plan.
Your expected rate of return is the single most powerful variable in any long-term financial projection. It influences how much you need to save each month, whether it makes sense to invest or pay off your mortgage faster, how you split your portfolio between stocks and bonds, and ultimately - when you can afford to retire.
A 1-2% difference in your assumption doesn't just nudge the outcome — it transforms it. Let's use a simple example. Suppose you invest $500 per month for 30 years:
- At 10% nominal: roughly $987,000
- At 7% nominal: roughly $567,000
- At 5% nominal: roughly $399,000
The gap between the optimistic and realistic scenarios is over $400,000. That's not a rounding error. For many Canadians, that's the difference between retiring at 60 and working until 67.
And here's the asymmetry that really matters: if you assume 7% and the market delivers 10%, congratulations — you may be able to retire early with a surplus. But if you assume 10% and the market delivers 7%, you discover a massive shortfall at the worst possible time, when you're too old to earn your way out of it. You have far more levers to pull now (save more, adjust your budget, take on a side project) than you will at 65.
That's why getting this number roughly right (you'll never know for sure) is so important. So let's look at where the 10% claim comes from — and why it falls apart under scrutiny.
Where the "10%" Comes From (And Why It's Misleading)
The number isn't made up. Going back to 1950, the S&P 500 has delivered an annualized nominal return of roughly 11%. Over the past 20 years, it's been closer to 10%. So when someone says "stocks return 10%," they're often referencing a real data point, whether that's the S&P 500 or some individual company/fund that has managed to over-achieve in the past.
But that data point is doing a lot of heavy lifting, and it obscures several layers of context that matter enormously for your financial plan.
Problem #1: Inflation eats your returns
That 10% is a nominal figure — it hasn't been adjusted for inflation. After accounting for the rising cost of living (historically around 2-3% per year in Canada), your real purchasing power grows by closer to 7%.
To see why that matters, think about what $100 could buy 15 years ago. Plug 2010 and 2025 into the Bank of Canada's Inflation Calculator and you'll find that $100 in 2010 has the purchasing power of roughly $140 today. Or consider something even more tangible: a Canadian domestic stamp cost $0.57 in 2010 and costs $1.44 today — a 153% increase in just 15 years.
Your retirement isn't funded by nominal dollars. It's funded by what those dollars can actually buy. When someone tells you to plan on 10% returns, they're almost certainly quoting a nominal number, which overstates the growth of your real wealth.
Problem #2: You don't hold the S&P 500
That 10% figure is from one specific country (the United States), denominated in one specific currency (U.S. dollars), measured at the index level (zero fees, zero taxes).
If you're a Canadian investor following a sensible strategy with a low-cost asset allocation ETF like XEQT, your portfolio looks nothing like the S&P 500. XEQT's approximate allocation is roughly 45% U.S. equities, 25% Canadian equities, 25% international developed markets, and 5% emerging markets. If you hold VGRO or XBAL, you also have a significant bond allocation dragging the blended expected return lower.
Using the S&P 500's historical return as a planning assumption for a Canadian globally diversified portfolio is like using a sports car's top speed to estimate your highway commute time. They're both "driving." The comparison ends there.
Problem #3: The U.S. has been the global outlier
This is the most important — and least appreciated — piece of the puzzle.
The U.S. stock market has been the single best-performing major equity market over the past 125 years. But "what happened in the best case" is a terrible foundation for financial planning. You wouldn't insure your home based on the assumption that fires never happen just because your house hasn't burned down yet.
The UBS Global Investment Returns Yearbook (2025 edition), based on the Dimson, Marsh, and Staunton dataset covering 35 countries from 1900 through 2024, tells the fuller story:
- U.S. equities: ~6.6% annualized real return
- World equities ex-U.S.: ~4.3% annualized real return
- World equities (including U.S.): ~5.2% annualized real return
That global figure of roughly 5% real is much closer to what a diversified all-equity investor should plan around. It's a far cry from the ~7% real that the "10% nominal" figure implies.
Why the U.S. Market Won't Necessarily Repeat Its Greatest Hits
Understanding why the U.S. has outperformed matters just as much as understanding that it has outperformed. Because the causes aren't the kind of thing you should count on repeating.
Rising valuations drove a significant chunk of returns
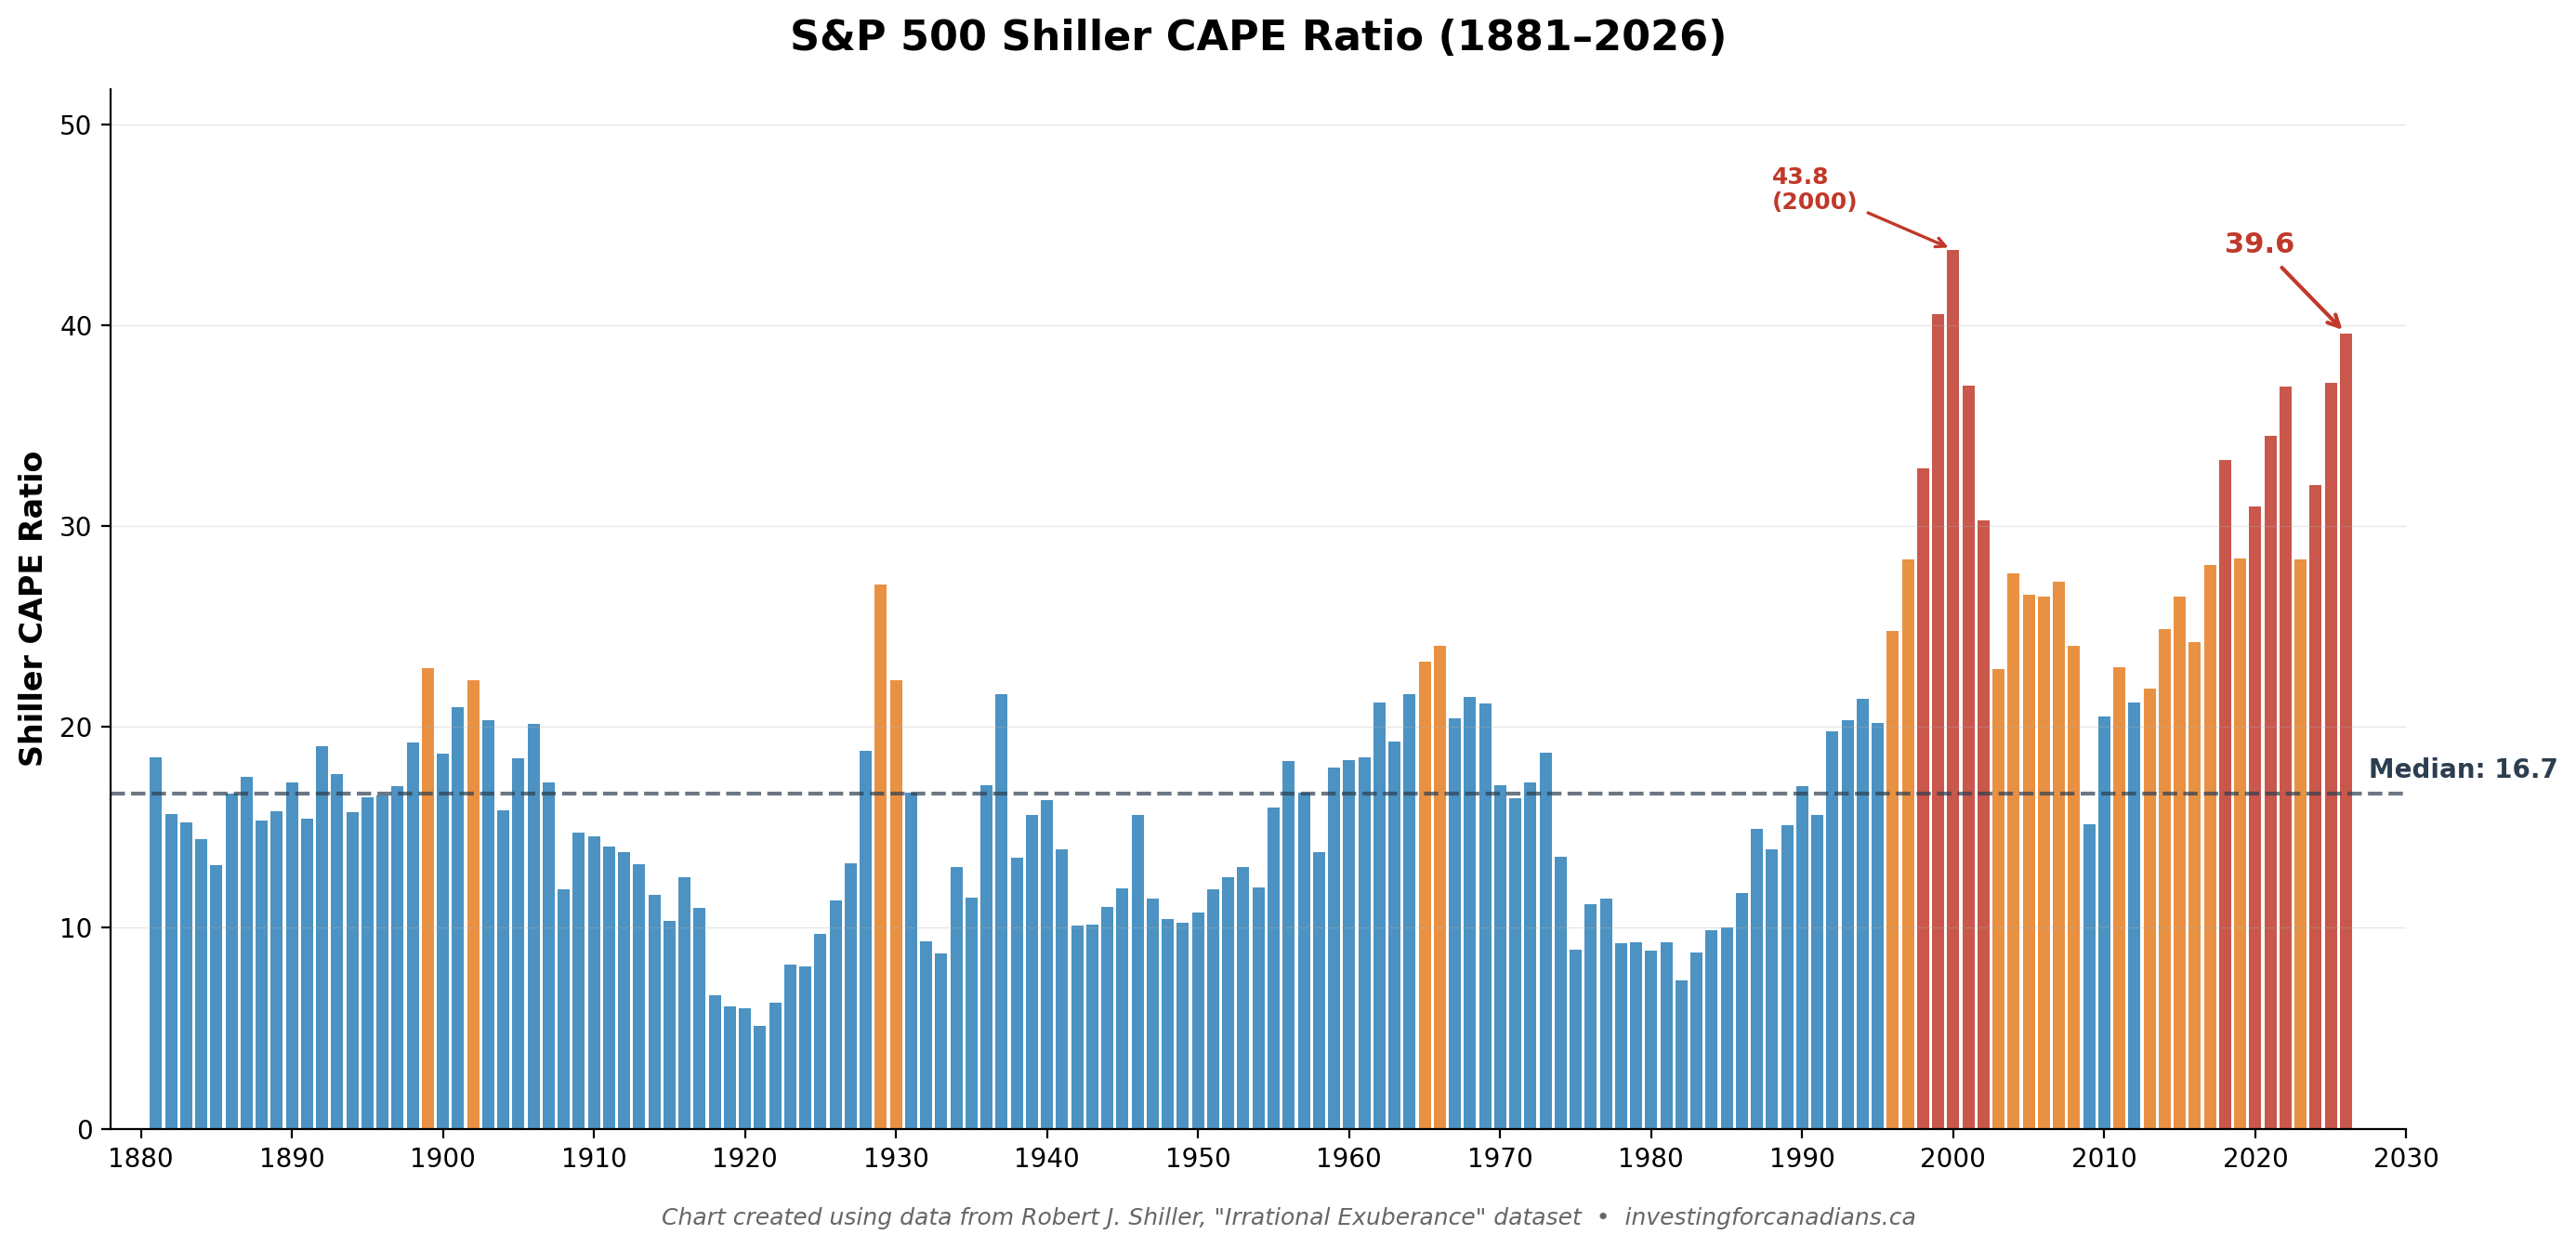
A major contributor to exceptional U.S. equity performance — particularly since 1950 — has been expanding valuation multiples. Investors have gradually been willing to pay more and more for each dollar of corporate earnings. This shows up clearly in the Shiller Cyclically Adjusted Price-to-Earnings ratio (CAPE), which has risen dramatically over the post-war period.
Here's why that matters: returns that come from growing earnings and dividends are potentially repeatable. Returns that come from people simply paying higher prices for the same earnings are not — unless you believe that multiples can expand forever, which makes no economic sense.
The Fama and French 2002 paper, "The Equity Premium," examined exactly this question. They found that from 1872 to 1950, realized U.S. equity returns roughly matched what you'd expect based on dividends and earnings growth. But from 1951 to 2000, the realized equity risk premium was nearly three times higher than what fundamentals alone would justify — the difference being driven by rising stock prices relative to earnings.
Survivorship bias and the "safe haven" effect
More recent academic work by Jules van Binsbergen and co-authors has explored another dimension: the U.S. market has survived without the catastrophic disruptions (major wars on home soil, hyperinflation, communist revolutions) that hit other countries. That survival wasn't guaranteed in advance — it was, in part, luck. And as decades of stability accumulated, investors increasingly perceived the U.S. as a safe haven, which drove further demand for U.S. equities and pushed valuations higher still.
Their research estimates that these two factors — survivorship bias and this "learning" effect — account for roughly 2% per year of the historical U.S. equity risk premium. Remove that, and you're back to around 5.3% real, which aligns closely with global averages.
Current valuations imply modest future returns
Today, the Shiller CAPE ratio for the S&P 500 sits around 37-39 — more than double its historical median of roughly 16. Inverting the CAPE gives a rough estimate of the expected real return being priced into stocks, which at current levels is approximately 2.5-3%.
For future U.S. equity returns to match the post-1950 historical average, you'd need either further valuation expansion from already historically extreme levels, or a string of positive economic surprises. By definition, surprises can't be planned for. The entire point of a financial plan is to build on expectations, not best-case hopes.
"But Investing Is Different Now"
This is the most common rebuttal, and it deserves a direct answer.
The argument usually goes: investing is easier and more accessible now than it was 50 or 100 years ago. More people participate. Technology has transformed markets. So the old data doesn't apply.
The problem is that this argument is exactly backwards.
When more people have access to stock markets, demand for equities increases. When markets are perceived as safer, investors demand less compensation for risk. Both of these forces push valuations up and push expected future returns down.
These dynamics help explain why past returns were so exceptional — valuations expanded as investing became mainstream and markets were perceived as increasingly stable. But they are reasons to expect lower returns going forward, not higher ones.
Think about it simply: if everyone already knows the U.S. stock market is a great place to invest, that knowledge is already embedded in current stock prices. The question for future returns isn't whether the U.S. market is amazing. It's whether it will be more amazing than current prices already assume. That's a much harder case to make.
What a Canadian ETF Portfolio Should Actually Expect
Let me get specific, because this is what you're here for.
FP Canada's official guidelines
Every year, FP Canada and the Institute of Financial Planning publish Projection Assumption Guidelines — the standard reference used by Certified Financial Planners across Canada. The guidelines blend historical DMS data, current Shiller earnings yields, CPP/QPP actuarial assumptions, and industry surveys to arrive at forward-looking return estimates.
The 2025 guidelines recommend the following gross nominal returns (before fees):
| Asset Class | Expected Return |
|---|---|
| Canadian equities | 6.6% |
| U.S. equities | 6.6% |
| International developed-market equities | 6.9% |
| Emerging market equities | 8.0% |
| Fixed income | 3.4% |
| Inflation assumption | 2.1% |
These are before any investment management fees are subtracted. Even with a low-cost ETF at 0.18% MER, your net return is lower.
What this means for your portfolio
Let's apply these assumptions to a portfolio like XEQT (approximately 45% U.S., 25% Canadian, 25% international developed, 5% emerging markets):
- 45% × 6.6% (U.S.) = 2.97%
- 25% × 6.6% (Canada) = 1.65%
- 25% × 6.9% (International) = 1.73%
- 5% × 8.0% (Emerging) = 0.40%
Weighted nominal expected return: ~6.75% before fees, or roughly 4.5-4.7% in real terms after inflation.
For a balanced portfolio like VGRO (80% equity, 20% bonds), the nominal expected return drops to roughly 6.0-6.2% before fees, with a real return closer to 4%.
That's a far cry from 10%.
A practical range for planning
Based on the academic evidence, professional guidelines, and current valuations, here's what I'd suggest for planning purposes:
- All-equity globally diversified (XEQT/VEQT): ~4-5% real (6-7% nominal)
- Growth-tilted balanced (VGRO): ~3.5-4.5% real (5.5-6.5% nominal)
- Balanced (XBAL/VBAL): ~3-4% real (5-6% nominal)
And just because you see XEQT having the highest return of those options, that does NOT mean I recommend it for everyone. There are other variables more important when picking an investment. If you're using my RRSP vs. TFSA Calculator or Compound Interest Calculator, the rate of return input is one of the most consequential assumptions in the entire projection. An overly optimistic assumption doesn't just make the numbers inaccurate — it can change the direction of the recommendation entirely.
You Probably Won't Even Capture the Full Market Return
Even these more realistic numbers assume you'll perfectly capture every basis point of market return. You almost certainly won't.
DALBAR's annual Quantitative Analysis of Investor Behaviour study has tracked the gap between market returns and actual investor returns since 1985. Their 2025 report (covering 2024 data) found that the average equity fund investor earned 16.54% while the S&P 500 returned 25.02% — a gap of over 8 percentage points in a single year. Over a 20-year period ending in 2024, the annualized gap was roughly 1% per year.
Morningstar's "Mind the Gap" research corroborates this, estimating that poor timing decisions (buying after rallies, selling after declines) cost the average investor roughly 1-1.7% per year.
The causes are deeply human: panic selling during bear markets, chasing recent performance, overconfidence in market timing, and holding periods that are far too short. These behaviours are incredibly difficult to eliminate even if you're aware of them — and they represent a real, additional drag on your returns that should inform your planning.
To be clear: as a buy-and-hold index investor using a single asset allocation ETF, you're already better positioned to avoid most of these traps than someone picking individual stocks or actively trading. But nobody is immune to behavioural error, and building in a small buffer for human nature is prudent.
The Case for Conservative Assumptions
I want to end on what I think is a genuinely optimistic point.
Using conservative return assumptions doesn't mean you're pessimistic about the stock market. It means you're building a plan that's robust — one that works across a wide range of outcomes, not just the best-case scenario.
If you plan for 5% real and the market delivers 7%, you're years ahead of schedule. You retire earlier than expected, spend more freely, or simply enjoy the peace of mind that comes with being ahead of the game. Those are wonderful problems to have.
The alternative — planning for 10% and hoping the market cooperates — puts you in a position where the best case is that things work out exactly as planned, and the worst case is discovering a serious shortfall when you're 62 with no realistic way to make up the difference.
The smartest financial plans leave room for things to go better than expected. That starts with honest assumptions about what the market is likely to deliver.
Key Takeaways
- The "10% return" claim is based on the nominal, pre-fee, pre-tax return of one country's stock market (the U.S.) during its best historical stretch. It's not a planning number.
- After inflation, U.S. stocks have returned roughly 6.6% real over 125 years. The global average is closer to 5.2%. Current U.S. valuations imply real returns of just 2.5-3% going forward.
- A globally diversified Canadian portfolio like XEQT has an expected nominal return of roughly 6.5-7% before fees, based on FP Canada's 2025 Projection Assumption Guidelines. In real terms, that's approximately 4.5-5%.
- A 1-2% difference in your return assumption can mean hundreds of thousands of dollars over a 30-year time horizon.
- Conservative assumptions protect you from shortfalls and create room for pleasant surprises. Aggressive assumptions do the opposite.
Data sources referenced: UBS Global Investment Returns Yearbook 2025 (Dimson, Marsh, and Staunton), FP Canada 2025 Projection Assumption Guidelines, DALBAR 2025 Quantitative Analysis of Investor Behaviour, Bank of Canada.
Stay Updated
Get the latest investment insights delivered to your inbox. We will not spam you with emails. Emails will be limited to around one per month, and may contain relevant market updates, new features, or new blog posts.
Image Gallery
More Articles
Market Analysis
Stay informed with our latest market insights and analysis.